
| 
|

In this chapter the requirement for visitor data, both qualitative and quantitative, which is pertinent to the Sussex Downs, is addressed. It has been shown in Chapter 5 that a substantial amount of data has been researched in recent years relating to visitors and tourism in the South East, but that this has major limitations as outlined in the opening paragraphs of Chapter 5. In addition it is noted in Chapter 5 that most of this data is quantified behavioural and demographic studies and that there is an absence of attitudinal research for the region.
Three types of research are therefore under consideration in this chapter.
Part 1. Attitudinal data aimed at increasing knowledge of perceptions of the Downland, both amongst visitors and non visitors.
Part 2. Behavioural and demographic data on visitors to the Downland who accord with the criteria for tourists as developed in Chapter 4.
Part 3. Volume and value analysis of recreational tourism on the Downland.
Each of these categories represents a major study area. The strategy adopted has been to marshall the resources of other agencies active in the region, particularly the SDCB, County Councils and MAFF, in order to pursue these investigations. As a result new data bases pertinent to Downland Tourism have been developed. These in turn have provided the foundation for new and original interpretations of Downland recreational tourism. The earlier research, identified in Chapter 5, has provided a valuable foundation on which to develop the further study.
Objective To determine the imagery and perception in the public's mind of the Downland.
Method From an extended list of words and phrases describing various aspects of leisure experience and association, respondents were asked to identify those words and phrases that they thought would or would not refer to a Downland visit.
Procedure A number of informal interviews were carried out in order to ascertain how people saw the Downs both as a place to visit and the type of experience that they may expect. From this research, coupled with the known character of the Downland, explored in Chapter 1, a list of words and phrases was compiled which summarised the Downland experience as it might and might not be. These were then divided into seven sub groups, a.activity type, b.venues, c.feelings, d.environment, e.visitor type, f.status of visit and g.transport. The prefixes were used to encode the words for analysis purposes.
In order to gauge a measure of importance between the various words and phrases, it was decided to obtain responses from the public in a manner that would enable a quantitative measure to be secured for ranking and comparative purposes. The list, which comprised 175 words and phrases, was produced in questionnaire form and respondents were asked to tick those words or phrases that they considered a Downland experience would be like, cross out those that it would not be like and leave blank where they were unsure. The list was jumbled to avoid repetitive, similar responses and consistency checks were inserted. A copy of the questionnaire is given in the appendix to this chapter.
Analysis was carried out using a Microsoft Works Spreadsheet and Charting package. The responses were scored 1=no, 2=unsure, 3=yes and the score by word or phrase aggregated. This then gave a measure of the degree to which the word or phrase reflects a respondent's expectation of the Downland experience. By subtracting nx2 from each total, the results are presented as a variance + or - from 0. (n = number of respondents) Initially it was piloted on 50 respondents, but the responses in some instances showed such consistency that it was decided to extend the exercise in order to give a more robust data base capable of limited sub sample analysis. As the survey progressed the sample was adjusted to give a spread of responses across age groups and sex. Particular emphasis was placed on securing respondents who lived away from the Downland, the degree to which could be determined from mileage phrases built into the questionnaire.
The survey was carried out in the Winter of 1992/3. This enabled findings to be incorporated in subsequent research. A problem of attitudinal research is that results are often valid in a certain context. For example, individuals wish to preserve the landscape from motorway building but at the same time want better roads. This cognitive dissonance can elicit inconsistent or potentially misleading results if not recognised. The survey was therefore drawn to a close when the results were consistent and sufficient to provide guidelines for further work. The survey was not intended to provide anything more than general indications rather than statistically precise information.
Results A total of 74 completed questionnaires was analysed. The close correlation of the median (0) and the mean (0.11) indicated a balanced overall result with positive and negative responses of similar frequencies. The method of analysis was by computer ranking, both by all responses and then by sub group. In addition the total sample was split into "frequency of visit" sub samples, those who had visited the Downland previously and those who had not. Each sub sample was then ranked for analysis. It was not practical to rank the sub samples by sub group within sub sample due to the size of the data base.
Details of the questionnaire, together with the ranking analysis are given in the appendix at the end of this chapter.
Findings The following adjectives are used in describing the degree of expectation for a particular word or phrase. Whilst this runs the risk of repetitive wording within the text, it does enable the reader to gain an appreciation for the relative importance of responses.
+/- 50 or more = major
+/- 40 - 49 = substantial
+/- 30 - 39 = large
+/- 25 - 29 = noticeable
Forty one percent of the selected words and phrases fell within the +/- 25 and higher range. The highest recorded figure was +57 for walking, the maximum obtainable was +/-74.
Total sample by 7 sub groups
Transport A substantial number of respondents expected to take the car and a noticeable number did not expect to use public transport or to have nowhere to stop the car.
Status of Visit For a substantial number of respondents a visit to the Downs would be a day trip and with friends. A large number would not expect to travel more than 100 miles. Caution needs to be exercised in interpreting the distance figure as this is more a reflection of the geography of the sample rather than the public at large, although these figures are endorsed by subsequent research in part 2 of this chapter.
Visitor Type A major expectation is that the Downs is suited to the middle aged. In addition a substantial number considered the experience suitable for children and a large number suitable for old people. The responses covered all of the age categories researched suggesting that the Downland has an appeal for the full spectrum of age bands.
There was no particular view as to whether family fun would be part of the Downland experience.
Environment A substantial number expected trees and woods with a large number anticipating sunny weather, clean air and grand scenery with rivers, farm animals and sheep grazing. Furthermore a noticeable number of respondents expected old villages, interesting geology and nature reserves with hedges or trees
What was not expected by a substantial number was a hostile environment, industrial estates and industrial pollution, untidiness or farmers in smocks. Also not anticipated by a large number of respondents were noisy farms with angry farmers, crowds, rural poverty or mountains. A noticeable number did not expect to find urban sprawl or bogs.
Traditional village customs, local dialect, rural crafts and similar heritage factors were not considered particularly significant, suggesting that Sussex culture is not high on the expectation of visitors.
Feelings A large number of respondents, by choice, would visit the Downs if the opportunity arose and a substantial number would see it as an enjoyable experience and not boring. It would also be healthy and a means of escape involving inland walks and not expensive for a large number. For a noticeable number it would be an exhilarating experience that would be looked forward to. Mysterious customs were not anticipated by a large number.
A number of responses were not identified as particularly significant, these included letting off steam and the Downland being a romantic place.
Venues A large number would expect to visit the coast and go for coastal walks. They would also see churches and ancient monuments and visit pubs. What they would not do is expect to stay in hotels or visit a circus. A coastal experience, perhaps visiting the beach, would be anticipated by a noticeable number, as would National Trust properties. They would not expect funfairs.
No particularly strong opinion was expressed about convenient toilets, castles and bed and breakfast.
Activity Of major importance was the expectations of going walking and exploring new places and these two considerations appear to sum up the Downland experience for many. A substantial number would expect to look at the views and would not expect nightclubs, shooting or witchcraft. Other things not expected by a large number included evening night life, wild parties or the lighting of fires. Voluntary work was also not anticipated. What they did expect was to be free and unhindered and to photograph. A noticeable number anticipated picnicking but would not expect to play golf, horse ride or rock climb. A few indicated that they would prefer the Mediterranean.
Frequency of Visit sub sample analysis
The total sample of 74 divided as follows:
Been before: 38 Not been before: 19 Unsure: 17
Changes in responses between the three sub samples provide an indication of attitudes based on direct and indirect experience of the Downland, but the low sample base endangers the statistical significance of the responses. Only those words and phrases where there was a substantial movement in the ranking as a result of the sub sampling are discussed.
Clean air Of those who had been before the expectation of clean air dropped appreciably and correspondingly rose with those who had not been before. This suggests that the delivery is not up to the anticipation and that this point is recognised by the public.
Eat Cheaply The same applies to eat cheaply as clean air.
Prefer Mediterranean Of those who had been before there was less inclination to prefer the Mediterranean.
Untidy There was less expectation that it would be tidy amongst those who had been before. The Downland therefore arguably is less tidy than those who have not visited imagine.
Nowhere to park the car and no hedges or trees
The likelihood of expecting both of the above to apply increases amongst those who have visited before.
Weekend, cycling and bed and breakfast Those who had not been before were more likely to consider the Downland experience would be a weekend visit, involve cycling and or bed and breakfast.
Conclusions
In spite of the wide variety of response options available to the respondents, the picture that emerges of the Downland is consistent with general perceptions and subsequent research. A danger was identified with the construction of the research in that respondents, anticipating the type of experience, may indicate their belief of what the Downland can deliver or what they ideally seek as an experience. In some instances the two could be diametrically opposed. Also the research was limited by the range of responses available to the respondent although every effort was made to list a broad based, comprehensive range of options.
The use of the car as a means of travel is a widespread expectation and the availability of coastline within the Downs or nearby is important. The Downland is a place where walking is the most significant expected activity and the concept of exploring new places, which also scored highly, gives insight into two of the fundamental appeals. The low response to heritage and cultural aspects indicates a lack of general importance. The Downs is a place for a day trip, particularly for the middle aged. The landscape conjures up images of the rural idyll although not necessarily a romantic place. The analysis of those who had previously visited the Downs and those who had not highlights a number of aspects where there are possible dissatisfactions which could be usefully addressed.
The findings of this research are not considered authoritative in their own right but a guide for further research.
Chapter 6; Part 2.
(Henceforth referred to as the Downland Visitor Survey)
During the preliminary investigation process for this Downland study it became apparent that two agencies at least were considering new empirical visitor research in areas that overlapped with the Sussex Downs. ESCC and WSCC were planning studies of behavioural and demographic visitor research through interviews and questionnaires. At the same time the SDCB, following an initiative and proposal by the author, approved a budget for research to be carried out on their behalf through the University of Sussex.[1]
A forum of interested parties was established which became known as the Sussex Downs Visitor Research Group, led by the author.[2] It was proposed that Brighton University would act as a central coordinator and contractor of three planned studies. Data would be collected across a large number of Sussex sites and then segregated according to the area requirements of each agency; a number of sites were common to more than one survey. This aspect gave considerably improved cost effectiveness and such methodology could well be applied elsewhere. A single questionnaire was devised which enabled compatible data to be secured across the aggregated sample. In spite of detailed discussions, ESCC were not able to reconcile their research requirements with the proposed questionnaire. As a result, WSCC and the University of Sussex proceeded on a joint venture with funding from a variety of sources including SDCB, SEETB and WSCC.
A provisional questionnaire was piloted in March 1993 by the author.
A key element in the research design was to avoid a sample bias resulting from individual site characteristics, a problem identified from earlier research. The survey therefore required the use of a large number of geographically independent sites. In addition any short term bias resulting from visitor fluctuations was reduced by implementing the research over a period of six months for each site.
In order to increase the sample size within the available budgets, the questionnaire was devised to be user friendly and not to require direct interview to ensure completion. The questionnaires were then initially distributed directly to visitors who were requested to complete and return in a prepaid envelope. The distribution took place on site. This technique had been previously adopted by Dartmoor NPA with some success.[3] Subsequent experience however indicated that a more effective response rate could be achieved by the researcher collecting completed questionnaires on site. This thereafter became the preferred procedure. A sample questionnaire is included in the appendix at the end of this chapter. The researched visitor sample was selected to accord with the broad criteria for tourists.[4]
Table 6:1 17 SITES FOR THE DOWNLAND VISITOR SURVEY.
List of sites for SDCB/University of Sussex Downland Visitor Survey available for integration into WSCC survey.
in East Sussex:-
02 Ditchling Beacon, National Trust
03 Hove, Foredown Tower
04 Wilmington Long Man/Charleston Farmhouse
16 Exceat/7 Sisters Country Park, National Trust, ESCC
17 Beachy Head, Eastbourne Borough Council land.
in West Sussex:-
05 Devils Dyke/Fulking Escarpment, WSCC, National Trust
06 Cissbury Ring, National Trust
07 Fairmile Open Space/Whiteways car park Nr Arundel, WSCC
08 Arundel Wildfowl car parks/recreation area, WSCC
09 Harting Down, National Trust, S. Downs Way, SU 080180, WSCC
10 Chanctonbury Ring, S. Downs Way, TQ 140120, WSCC
Sites from WSCC visitor survey for integration into SDCB/Univ. of Sussex survey:-
11 Amberley Chalk Pits/Meadows, WSCC
12 Weald and Downland Museum, Singleton.
13 Goodwood Country Park, WSCC
14 Eartham Forest, Forestry Enterprise car park off A285, 938106.
15 Stansted House and Park, near Havant and Fishbourne
In addition WSCC researched 11 further sites off the Downland, for analysis in their own survey, the results of which are available for assessment elsewhere.
In order to ensure an adequate sample, targets were set for questionnaires completed. At each of the 17 Downland sites up to 500 visitors were researched. These were spread over five occasions, at approximately monthly intervals between May and October 1993. Early experience indicated that visitor numbers were insufficient on some sites to complete the quota in a reasonable time. Some adjustment was necessary on a day to day basis to bring the number of returned questionnaires up to near the seventy percent of the maximum distributed, which was the target sought.
Total planned maximum responses were therefore:
70 % of 17x500 = 5,950
Useable returned questionnaires, in the event, totalled 5040, which was 85 percent of the target sought.
At this level a robust sample resulted that gave high confidence level sub-sample analysis. Results were coded and fed into SPSS software at the University of Brighton. After 1,974 data sets had been computerised, the data was exported to the University of Sussex computer and a trial analysis carried out. This enabled a number of refinements to be made prior to eventual analysis of the entire data sets. It also proved the compatibility of the two University's systems. When the full data set was available, it was exported to the University of Sussex computer facility. This enabled further analysis, including the investigation of sub samples through cross tabulation and the development of a correlation matrix in the examination of user groupings. Some of the statistical analysis was carried out using spreadsheet software.
In addition to the analysis carried out for this thesis, two separate reports on the Downland and West Sussex "all data" findings have been prepared and issued by The University of Brighton, as contractors. These reports contain only limited sub-sample analysis.[5] The reports are identified in the following text, where specific conclusions have been referred to that are pertinent and additional to the findings of the analysis carried out for this thesis.
The principal findings are also summarised in a leaflet prepared by the author and published by the SDCB for public relations purposes.[6]
Table 6:2 VISITOR SURVEY RETURNS
Site Number Number returned as a percentage
No Distributed Returned of 500 of total of those
to site from site maximum sample distributed
01 500 343 69 6.8 69
02 500 463 93 9.2 93
03 435 211 42 4.2 48
04 500 377 75 7.5 75
05 500 382 76 7.6 76
06 357 152 30 3.0 43
07 500 257 51 5.1 51
08 500 233 47 4.6 47
09 307 153 31 3.0 50
10 500 167 33 3.3 33
11 500 234 47 4.6 47
12 500 435 87 8.6 87
13 500 483 97 9.6 97
14 453 283 57 5.6 57
15 195 141 28 2.8 72
16 500 385 77 7.6 77
17 500 341 68 6.8 68
Totals 7729 5040 n/a 100.0 65
In the evaluation of the data, the significance of doubtful relationships was checked using the Chi-square test and disregarded if below a confidence level of 95 percent. A computer spread sheet was devised for this purpose using MicroSoft Works.
Principal Findings, total sample
The principal conclusions are summarised in the following evaluation which is based on the analysis of the total Downland data. In addition two sets of sub-samples are considered in detail. There is considerable scope for further data analysis to explore specific issues beyond the immediate concern of this thesis.
The frequency of questionnaire returns across sites, see table 6:2, confirms that a well distributed sample has been achieved with no single site accounting for more than 9.6 percent of total responses. In addition the 5040 total useable questionnaires ensured sub-sample analysis with high confidence levels. From the data analysis the date and month of interview were also well distributed, May - Sept being the period when the field research was completed. Eighty eight percent of the interviews were carried out during a weekend when visitors were most apparent.
Personal Profile of typical Downland visitors Three in four visitors were on a day trip, with the balance staying away from home overnight. This is not in accordance with data for West Sussex overall where the expectation is a ratio of 45 percent overnight visitors to 55 percent day trippers identified from data source (4).[7] The Downland is not typical of other South East surveys in this respect. This important difference in behaviour is therefore investigated in a sub sample analysis.
About one third of all visitors were couples, a further third were in family groups. Organised parties only accounted for just over 5 percent of the total. The balance was evenly split between those visiting on their own and those with others who were not family or friends. One explanation for the low percentage of parties may be the timing of the surveys, with 70 percent of all questionnaires being completed at weekends. This would have reduced the likelihood of school parties but in turn would be offset by the likelihood of other groups at weekends such as scouts or guides. Standeven calculates the average group size to be in the range 2.73-3.81 and suggests that the average group comprised two adults and a child.[8] The range gives a median of 3.27 persons.
Of all visitors, 55 percent were male and 45 percent female. Within this, distinct age clustering is apparent, with 44.5 percent of respondents being aged 25-44 years and 32.6 percent 45-64 years. Aggregated, this suggests that the Downland is a particularly popular venue for those in the 25-64 age bands with three quarters of all adult visitors falling in this range. There is also a strong bias towards the visitor being in the more affluent social scale categories. Over 40 percent of respondents were in senior management/middle management grouping compared with the average for the population at large of 17 percent. Allowing for misrepresentation by respondents, which is difficult to measure, there is still likely to be a strong leaning towards managerial occupations and away from the semi-skilled manual category, which accounted for only 3 percent of respondents. Standeven suggests that this may in part be due to lack of access to a car.[9]
Seven percent of visitor groups included a person registered disabled or who had a handicap. Five percent of groups included a wheelchair user.
Asked how the visitor found out about the interview location, 54 percent said that they had always known about the venue and a further 16 percent indicated word of mouth. These figures indicate how deeply the Sussex Downs is ingrained into the culture and awareness, with the promotional media performing only a minor role overall in attracting visitors.
Downland visitor catchment and travel Forty seven percent, nearly half of all visitors, came from Sussex and 77 percent had come from home. This firmly suggests that the Downland is an important local recreational facility and is nearly double the percentage quoted for West Sussex venues generally.[10] In addition a further 24.1 percent of visitors came from adjacent counties, that is Kent, Surrey or Hampshire. On the Downland an aggregated 71 percent of visitors came from the local south east counties compared with 61 percent identified in the earlier West Sussex survey.[11] This further endorses the importance of the Downland as a local recreational facility. There is a corresponding reduction in the percentage of visitors from more distant catchment areas.
By removing the local south east county's figures from the data, the places of origin for visitors from further afield can be clarified. These are compared with the comparable West Sussex survey [4] with reworked data in Figure 6:2.
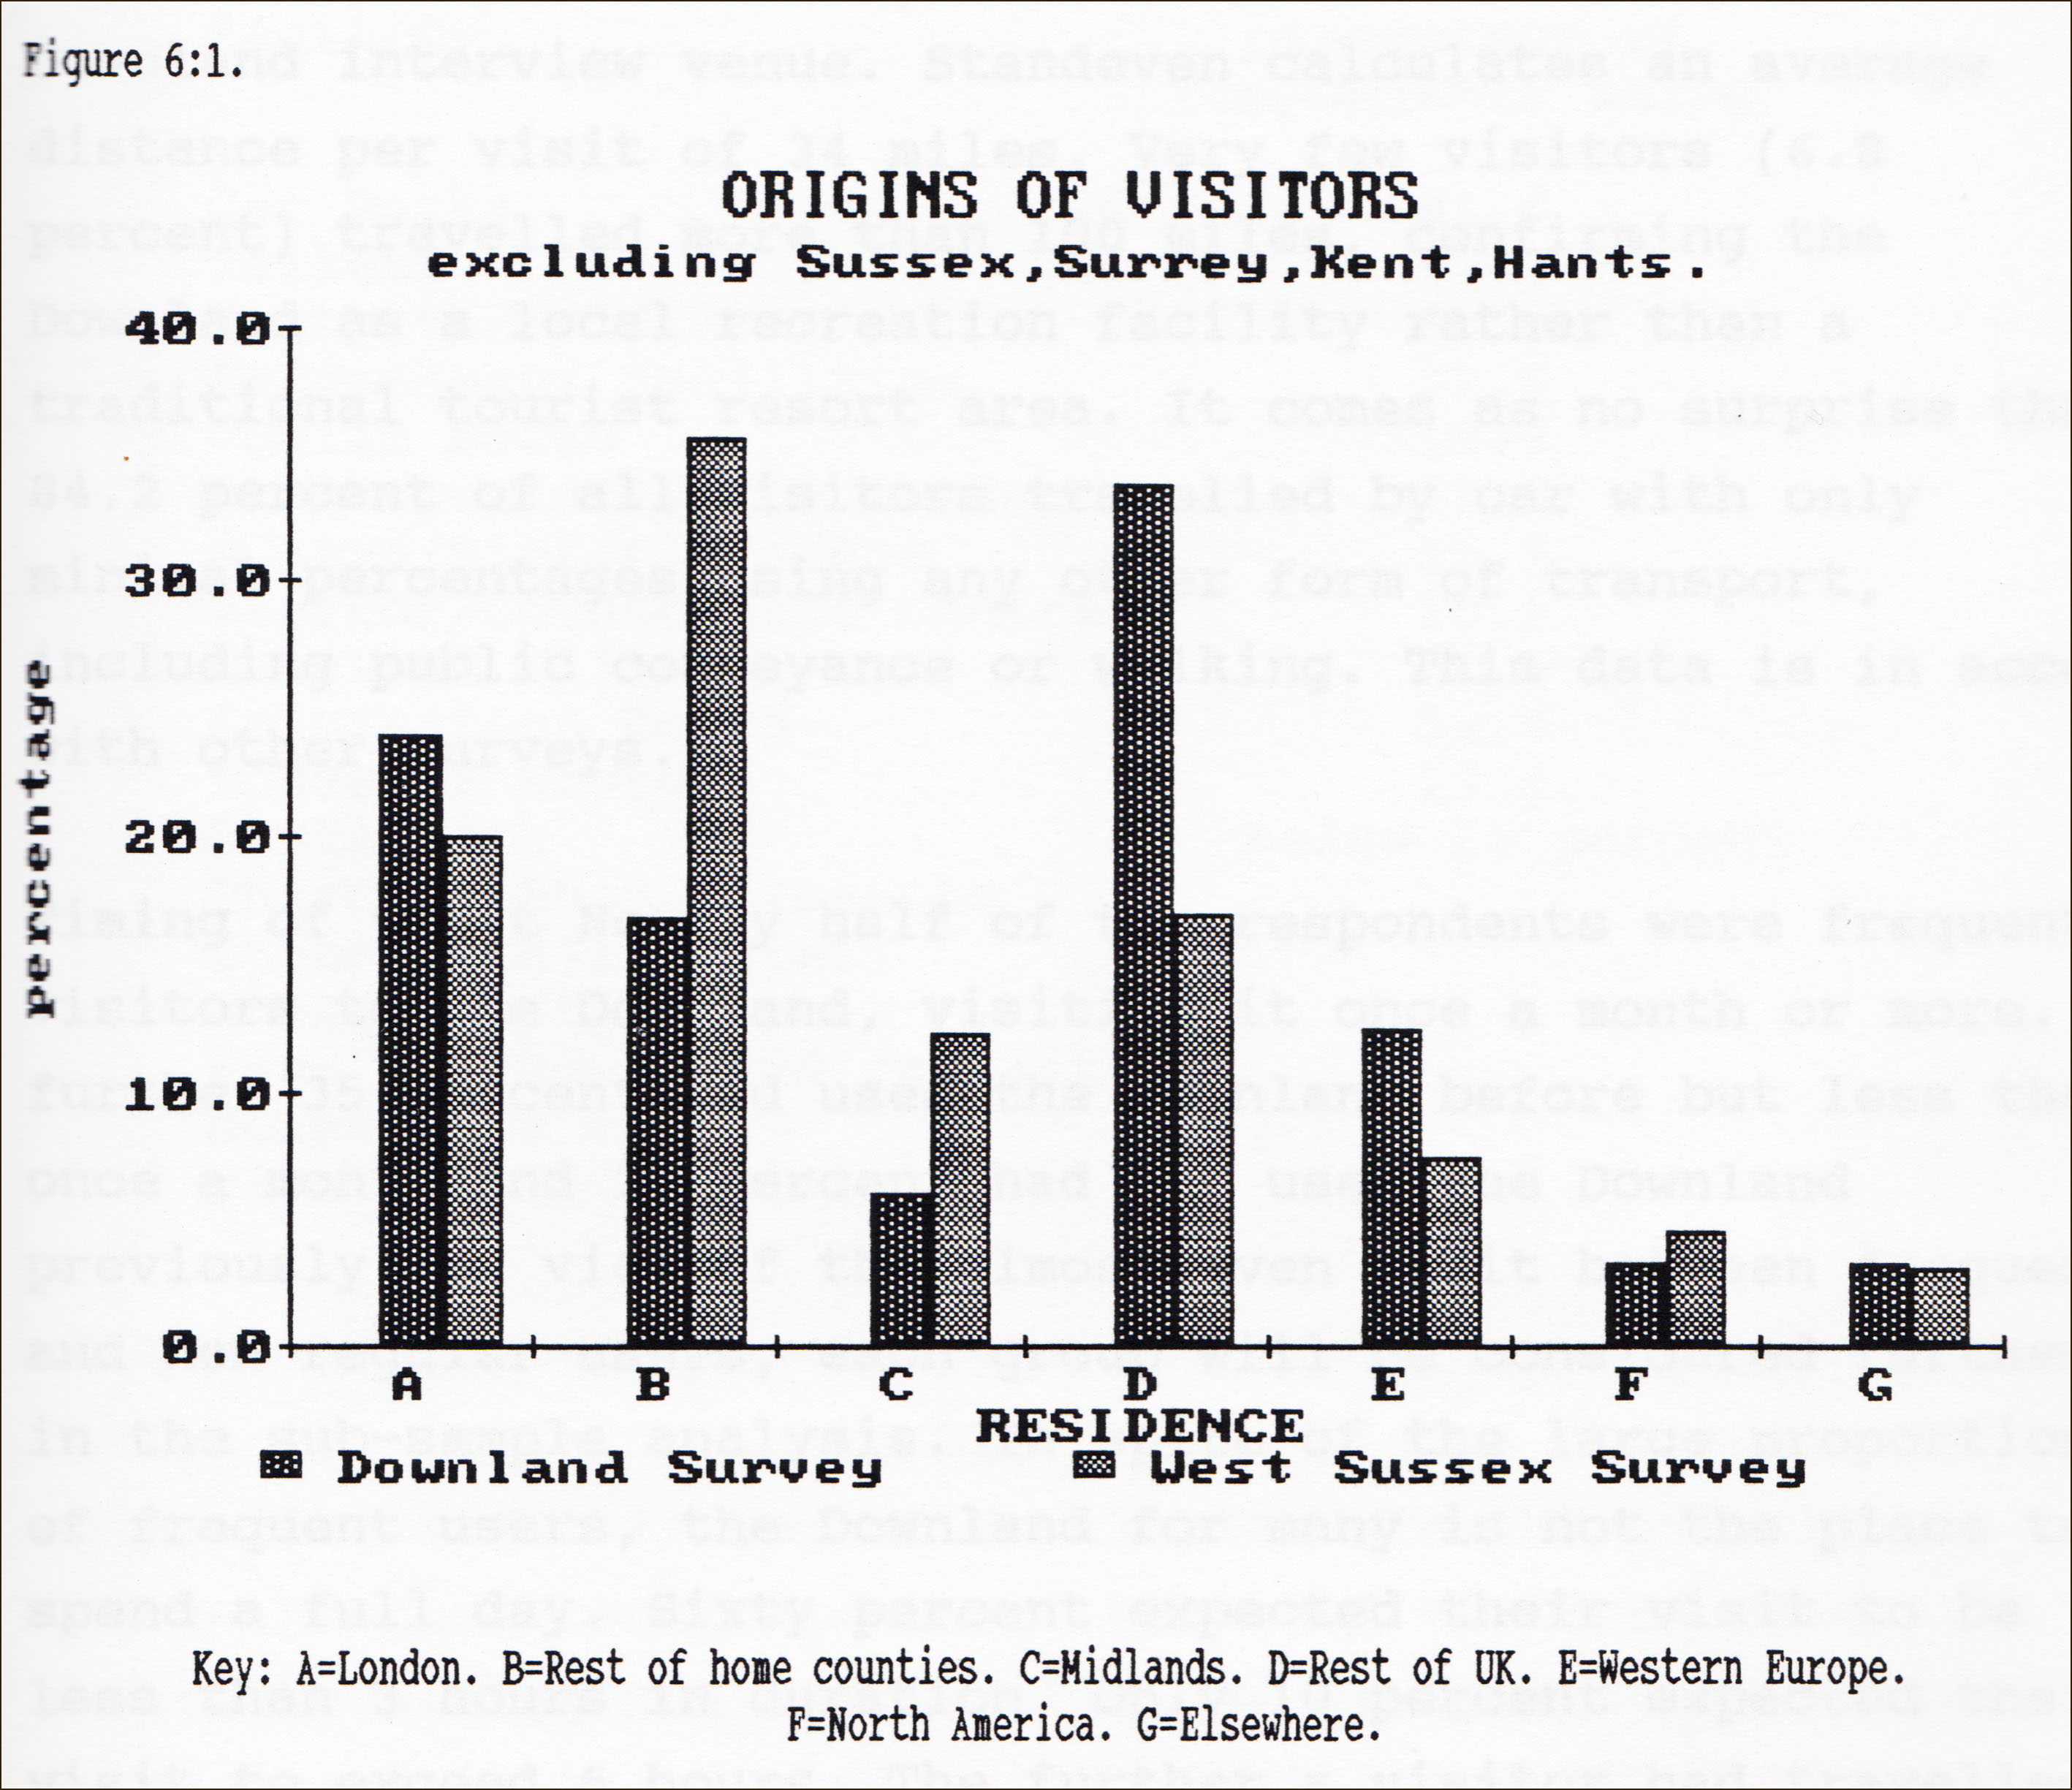
It can be seen that where the Downland differs from the earlier West Sussex general study is that the Downland fails to attract visitors from the rest of the home counties, compared with West Sussex, but does attract visitors from the rest of the UK to a greater extent. The relationship between place of residence and day or overnight trip is explored in the sub-sample analysis. The data could be interpreted as suggesting that the Downland has less appeal to the general public from adjoining counties but may have a specialised interest for enthusiasts from further afield within the UK.
The high percentage of all visitors emanating from Sussex is endorsed by the data on distance travelled. Eighty percent of all visitors travelled, in the day, 50 miles or less, suggesting a place of origin at least within 25 miles of the Downland interview venue. Standeven calculates an average distance per visit of 34 miles. Very few visitors (6.8 percent) travelled more than 100 miles, confirming the Downland as a local recreation facility rather than a traditional tourist resort area. It comes as no surprise that 84.2 percent of all visitors travelled by car with only minimal percentages using any other form of transport, including public conveyance or walking. This data is in accord with other surveys.[12]
Timing of visit Nearly half of the respondents were frequent visitors to the Downland, visiting it once a month or more. A further 35 percent had used the Downland before but less than once a month and 17 percent had not used the Downland previously. In view of the almost even split between frequent and non regular users, each group will be considered further in the sub-sample analysis. In spite of the large proportion of frequent users, the Downland for many is not the place to spend a full day. Sixty percent expected their visit to be less than 3 hours in duration. Only 10 percent expected their visit to exceed 6 hours. The further a visitor had travelled the longer was the likely stay, an aspect identified as a result of further analysis by Standeven.
Utilisation of facilities The extent to which specific facilities are used is ranked in Table 6:3. In view of the high incidence of car travel identified earlier, the importance placed on car parks, comes as little surprise .
Table 6:3
RANKED ORDER OF FACILITY UTILISATION ON THE DOWNLAND
facility percentage of respondents using
Car Parks 81.6
Toilets 57.2
Footpath/bridleway 41.8
Refreshment facilities 32.6
Public House 18.7
Area specially for outdoor rec. 17.6
Museum/Historic homes 15.7
Visitor/Countryside centre 15.1
Downland Village 14.0
Information Board 13.6
Souvenir Store/s 12.1
Restaurant below 10 percent
Church/Cathedral/Castle
Other retail outlet
Amusement/theme park
None of the listed facilities
Horse race track
Disabled facilities
Car parks, toilets, paths/bridleways/places for outdoor recreation and refreshment facilities are the principal infrastructure requirements of Downland visitors. The strategic siting and availability of car parks are a key determinant in the distribution of visitors. They clearly provide a powerful management tool. Roads, paths and bridleways provide the communication between Downland sites and the implications of this are discussed later in this thesis. The provision of refreshment facilities is a key determinant in the establishment of visitor honeypots, particularly if linked with places set aside for outdoor recreation, and again this is considered later in the context of visitor impact management.
Having established the key infrastructure requirements of present Downland visitors it is notable that the vast majority of visitors (97 percent) were satisfied with the general standards of facilities. Investigating this further, Standeven ascertained that in West Sussex, the generally high levels of satisfaction were unrelated to any entry fees incurred.[13]
The type of enjoyment derived from the Downland can be gauged from the ranking of the activities participated in, see table 6:4.
Table 6:4
ACTIVITIES PARTICIPATED IN ON THE DOWNLAND
ranked by percentage
activity percentage of visitors participating
Enjoying the view 50.9
Walking less than 2 miles 35.5
Casually sightseeing 33.9
Picnic 30.2
Walking more than 2 miles 29.9
Outdoor recreation 26.6
Visiting specific attractions 18.9
Visiting stately home/historic site/church 14.2
Exercising dog 12.8
Reading 10.3
Natural history/wildlife study 10.3
Visiting nature reserve under 10 percent
Informal games
Off road cycling
Kite flying
Watching organised sport
Road cycling
Organised outdoor event not to do with sport
Activity sport
Painting or sketching
Swimming
Horseriding
Angling
Coach Excursion
Metal detector treasure hunting
From the large group of activities participated in by less than 10 percent of visitors, it is apparent that these are not central to the Downland experience. This is not to say that such activities are of low impact. Off-road cycling has a significant environmental impact both on other users of bridleways and on surface soil erosion. The principal users of the Downland are concerned with the first 11 activities in table 6:4. In order to explore this aspect further each activity will be evaluated in the sub-sample analysis in Chapter 7, thereby providing a detailed understanding of the principal user groups.
Visitor expenditure In order to estimate actual expenditures, visitor numbers by value category have been multiplied by the median value of each category. In the case of UK pound 20+, a figure of UK pound 25 has been used. The average daily overall expenditure per visitor was UK pound 15.98 although all individual expenditure will later be reconsidered in the light of group expenditure.
1. Food and Drink
Food and Drink is the area where the highest expenditure is anticipated by the visitor with transport the second.
On average the typical Downland visitor spends UK pound 5.4 on food and drink. Twenty percent expect to spend nothing and a further 59 percent expect to spend less than œ8. Although the percentage of visitors with expenditure above UK pound 8 is small, the higher expenditure per capita results in gross revenue increasing for the higher value category. This suggests that "high spend, low volume" offers better returns than "low spend, high volume". This marketing consideration particularly applies in the UK pound 20+ value category but only in the Food and Drink sector.
2. Travel
Eighteen percent of all visitors expect to pay nothing in travel costs with a further 67 percent paying less than œ8. The percentages for the higher value categories reduced dramatically and this can be interpreted as UK pound 10 being about the maximum that the majority would be expecting to have to spend on travel. The average is UK pound 4.60.
3. Entry Fees
These are without doubt not considered part of the Downland experience by many. The average is UK pound 3.50 but 46.6 percent expect to pay nothing at all.
4. Other
Little or no other expenditure is anticipated by 85 percent of visitors who would not expect to pay more than UK pound 5. Fifty seven percent of the total expect to pay nothing. The average is UK pound 2.60.
Care needs to be exercised in applying these expenditure figures. They would not for example apply to children and may well reflect the expenditure of the group leader rather than each individual in the group, depending on the nature of the group. The data does give important relative relationships between different types of expenditure. The economic implications are debated further in Chapter 13.
Sub sample 1 - day versus overnight stay
Having evaluated the overall results, the two complementary sub samples based on "day trip" or "overnight stay" are considered. These represent two distinct types of tourism style and the data enables a new understanding of how they differ to be gained. In many respects the sub samples display similar characteristics but in certain instances there are distinctions which are indicative of different behavioral traits.
The overnight stay sample also provides detailed information on the nature of their stay. This in turn enables an appreciation to be gained of tourism infrastructure requirements for this sector.
Origin of visitors Of the overall survey sample, 77 percent of visitors were day trippers. Over four fifths (83 percent) of these day trippers came from the four south eastern counties of Sussex, Surrey, Kent and Hampshire. Overnight stay visitors accounted for 23 percent of visitors and this is in accordance with the South Downs Way surveys.[14] Overnight stay visitors, as would be expected, generally came from further afield, either in the UK or Europe. For example, a significant 11 percent came from other Western European Countries compared with only 2 percent of the day trippers. Those overnight tourists from countries beyond Europe was minimal. Overseas residents only comprise 16 percent of all overnight visitors on the Downland and this is substantially less than for Sussex overall at 40 percent as quoted in chapter 5.[15] Table 5:1 "Overnight tourism in Sussex". illustrates the economic importance of the overseas sector, which the Downland is failing to attract in the same percentages as tourism venues elsewhere. This is thought to be a result of high numbers of local visitors however, rather than a deficiency in appeal or marketing.
Nature of stay (overnight stay sub sample only) Fifty four percent of this sub sample were on holidays of three nights away or less. This exceeds the figures quoted in table 5:5 for tourism in the South East although caution must be exercised in the definition of short holidays. In spite of this, short holidays are an important market sector for Downland tourism and trends outlined in Chapter 5 suggest that this sector will increase in the future.
The type of accommodation used differs substantially from the UK profile illustrated in table 5:2. which provides a useful comparison. Staying with friends and relatives was less important, with paid accommodation given greater emphasis by the Downland visitor. Touring caravans were used by 16 percent of the overnight visitors and this is greater than the source (4) figures quoted in table 5:2. Touring caravans are particularly important for the Downland overnight tourist, with numbers comparable to those using hotel accommodation or those using bed and breakfast/guest house accommodation. Standeven identifies a similar scenario in the West Sussex overnight visitor data and compares the 14 percent with 4 percent nationally.[16] This suggests a market opportunity, the implications of which should be considered fully in the context of the siting of necessary infrastructure.
A significant 56.5 percent of overnight visitors stayed at an inland location, 43.5 percent at a seaside location. The south coast tourist resorts are not the principal dormitory for visitors to the Downland in spite of their long established and vast resources. They are nevertheless an important resource.
Personal profile of Downland visitors The overnight and day visitor differ little in personal profile. There are some interesting variations on how each found out about the Downland location however as illustrated in table 6:5.
Table 6:5
How did you find out about this place?
percentage visitors day overnight
Always known about it 66 29
Leaflets/brochure 6 16
Word of Mouth 12 30
other 16 25
Total 100 100
If the data in table 6:5 is considered in conjunction with the data on how often the Downland is used, an insight can be gained as to how overnight tourists discover the Downland. Overnight visitors record a high percentage (44%) of those who have never used the Downland before. This compares with 10 percent for day visitors. The hypothesis is therefore that many overnight visitors are unaware of the Downland before their visit. Table 6:5 suggests that word of mouth and brochures are then an important means of communicating information about the Downland to overnight visitors. This has implications for the marketing stance adopted with regard to Downland tourism.
Utilisation of facilities The overnight and day visitors are similarly inclined to use a car for transport and the use of many countryside facilities is similar for both sub samples. Where they differ however is in the likelihood of visiting formal locations. The overnight visitor is more likely to visit Ancient Monuments, Museums/Historic Homes, Downland Villages, Souvenir and other retail outlets, Churches/Cathedrals/Castles and to use information boards or use a Countryside Visitor Centre. The overnight visitor is also likely to read more, and this may be an oblique reference to guide books and other informative text. The overnight visitor is less likely to use bridleways and footpaths. Neither sub-sample indicates a strong interest in Amusements/Theme Parks. The overnight visitor therefore has a different profile of activities which reflect the wish to explore the Downland to the full. The day visitor by contrast appears more orientated towards a simpler programme of outdoor recreation.
Visitor expenditure Overnight visitors spend more than day trippers in all the expenditure categories researched. Overall they spend an average of UK pound 23.13 compared with day trippers who spend UK pound 13.74. In particular they also have a greater expectation of paying more than UK pound 20 for Food and Drink, compared with the day tripper. This reflects their preparedness to visit more formal locations and that, being on holiday, they expect to have to spend more on food away from home. These points indicate that, per person, day trippers are lower economic generators than overnight visitors in the tourism markets. Day trippers outnumber overnight visitors 3:1 however and the additional numbers of day trippers more than compensates for the propensity to spend less. Day trippers spend less per capita but overall, aggregate a larger gross sum whereas the overnight visitors spend more per capita but less overall. Expenditure is explored further in Chapter 13.